MacOS menu bar app for capturing context throughout the day.
Smartsheet Reports
Context
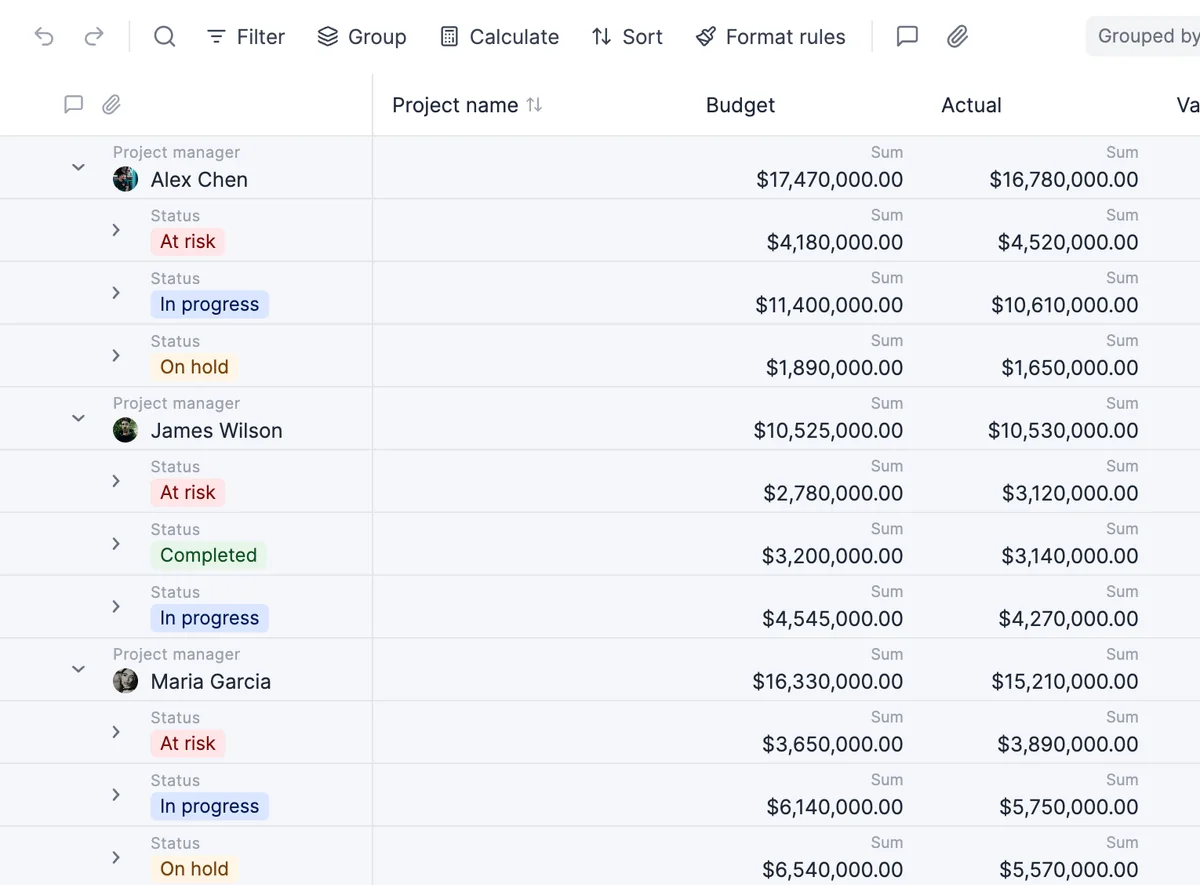
Smartsheet spent much of the early to mid-2020s rebuilding the core views within its primary asset, the sheet. Bringing those new views to reports, the surface that combines data across multiple sheets, was the next step in that platform strategy.
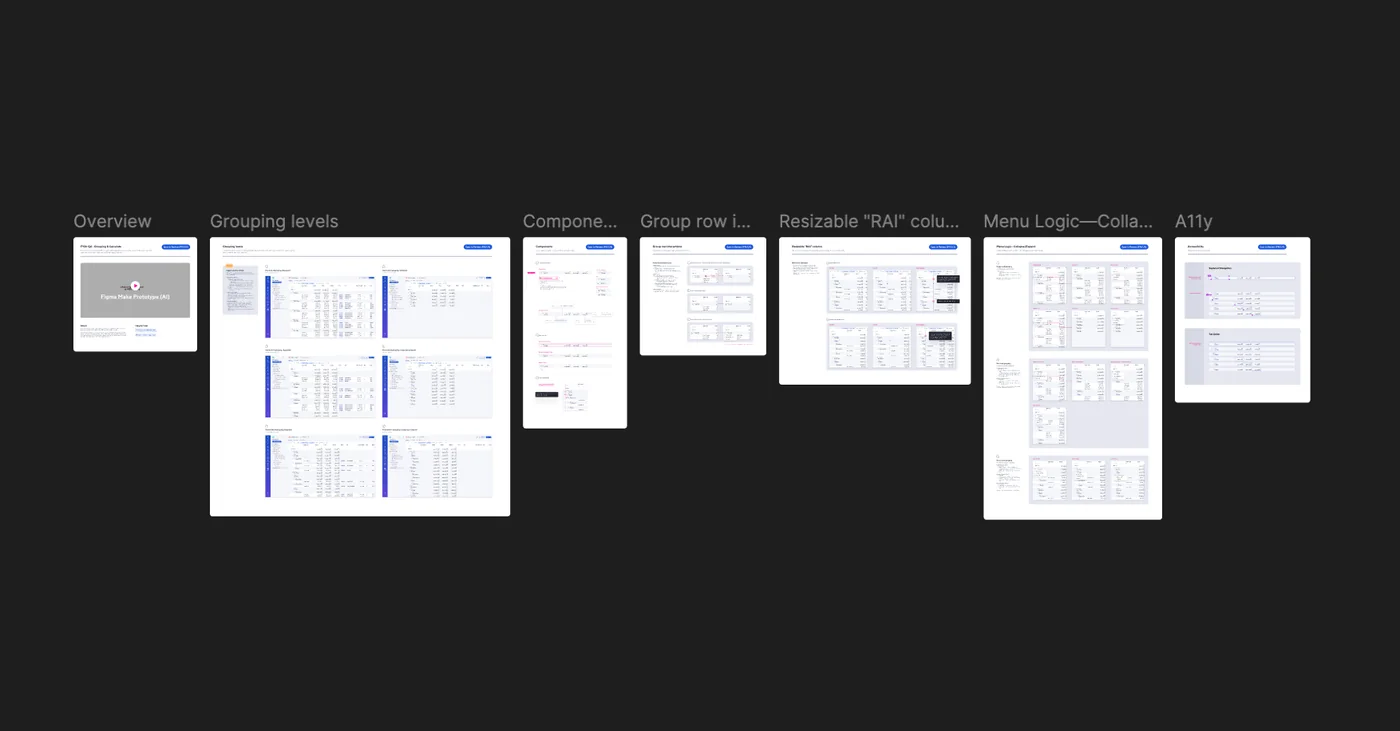
I was responsible for modernizing reports, but the project quickly grew beyond a visual refresh. We rethought the aggregation experience, addressed years of customer feedback, and resolved long-standing usability issues.
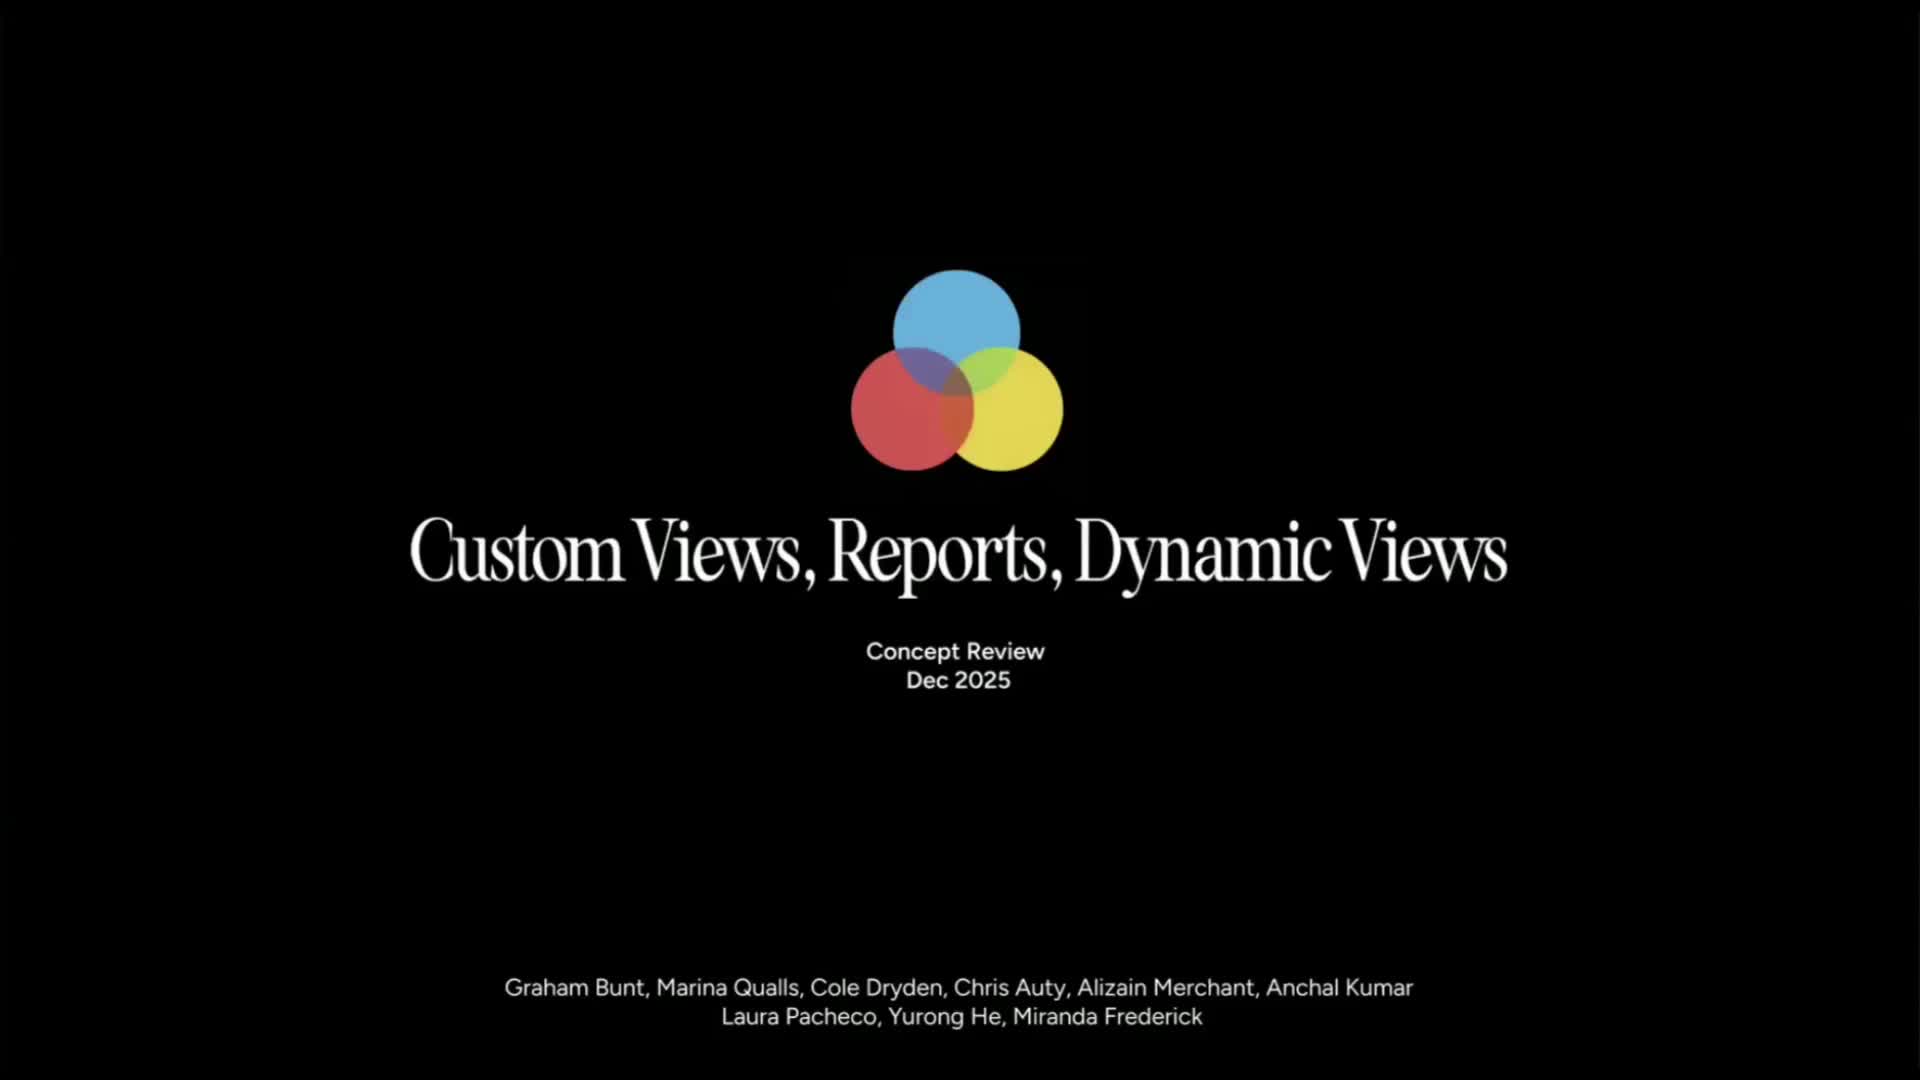
When the work began to overlap with adjacent platform capabilities, I stepped in to align three converging teams and help define the long-term role reports should play within Smartsheet.
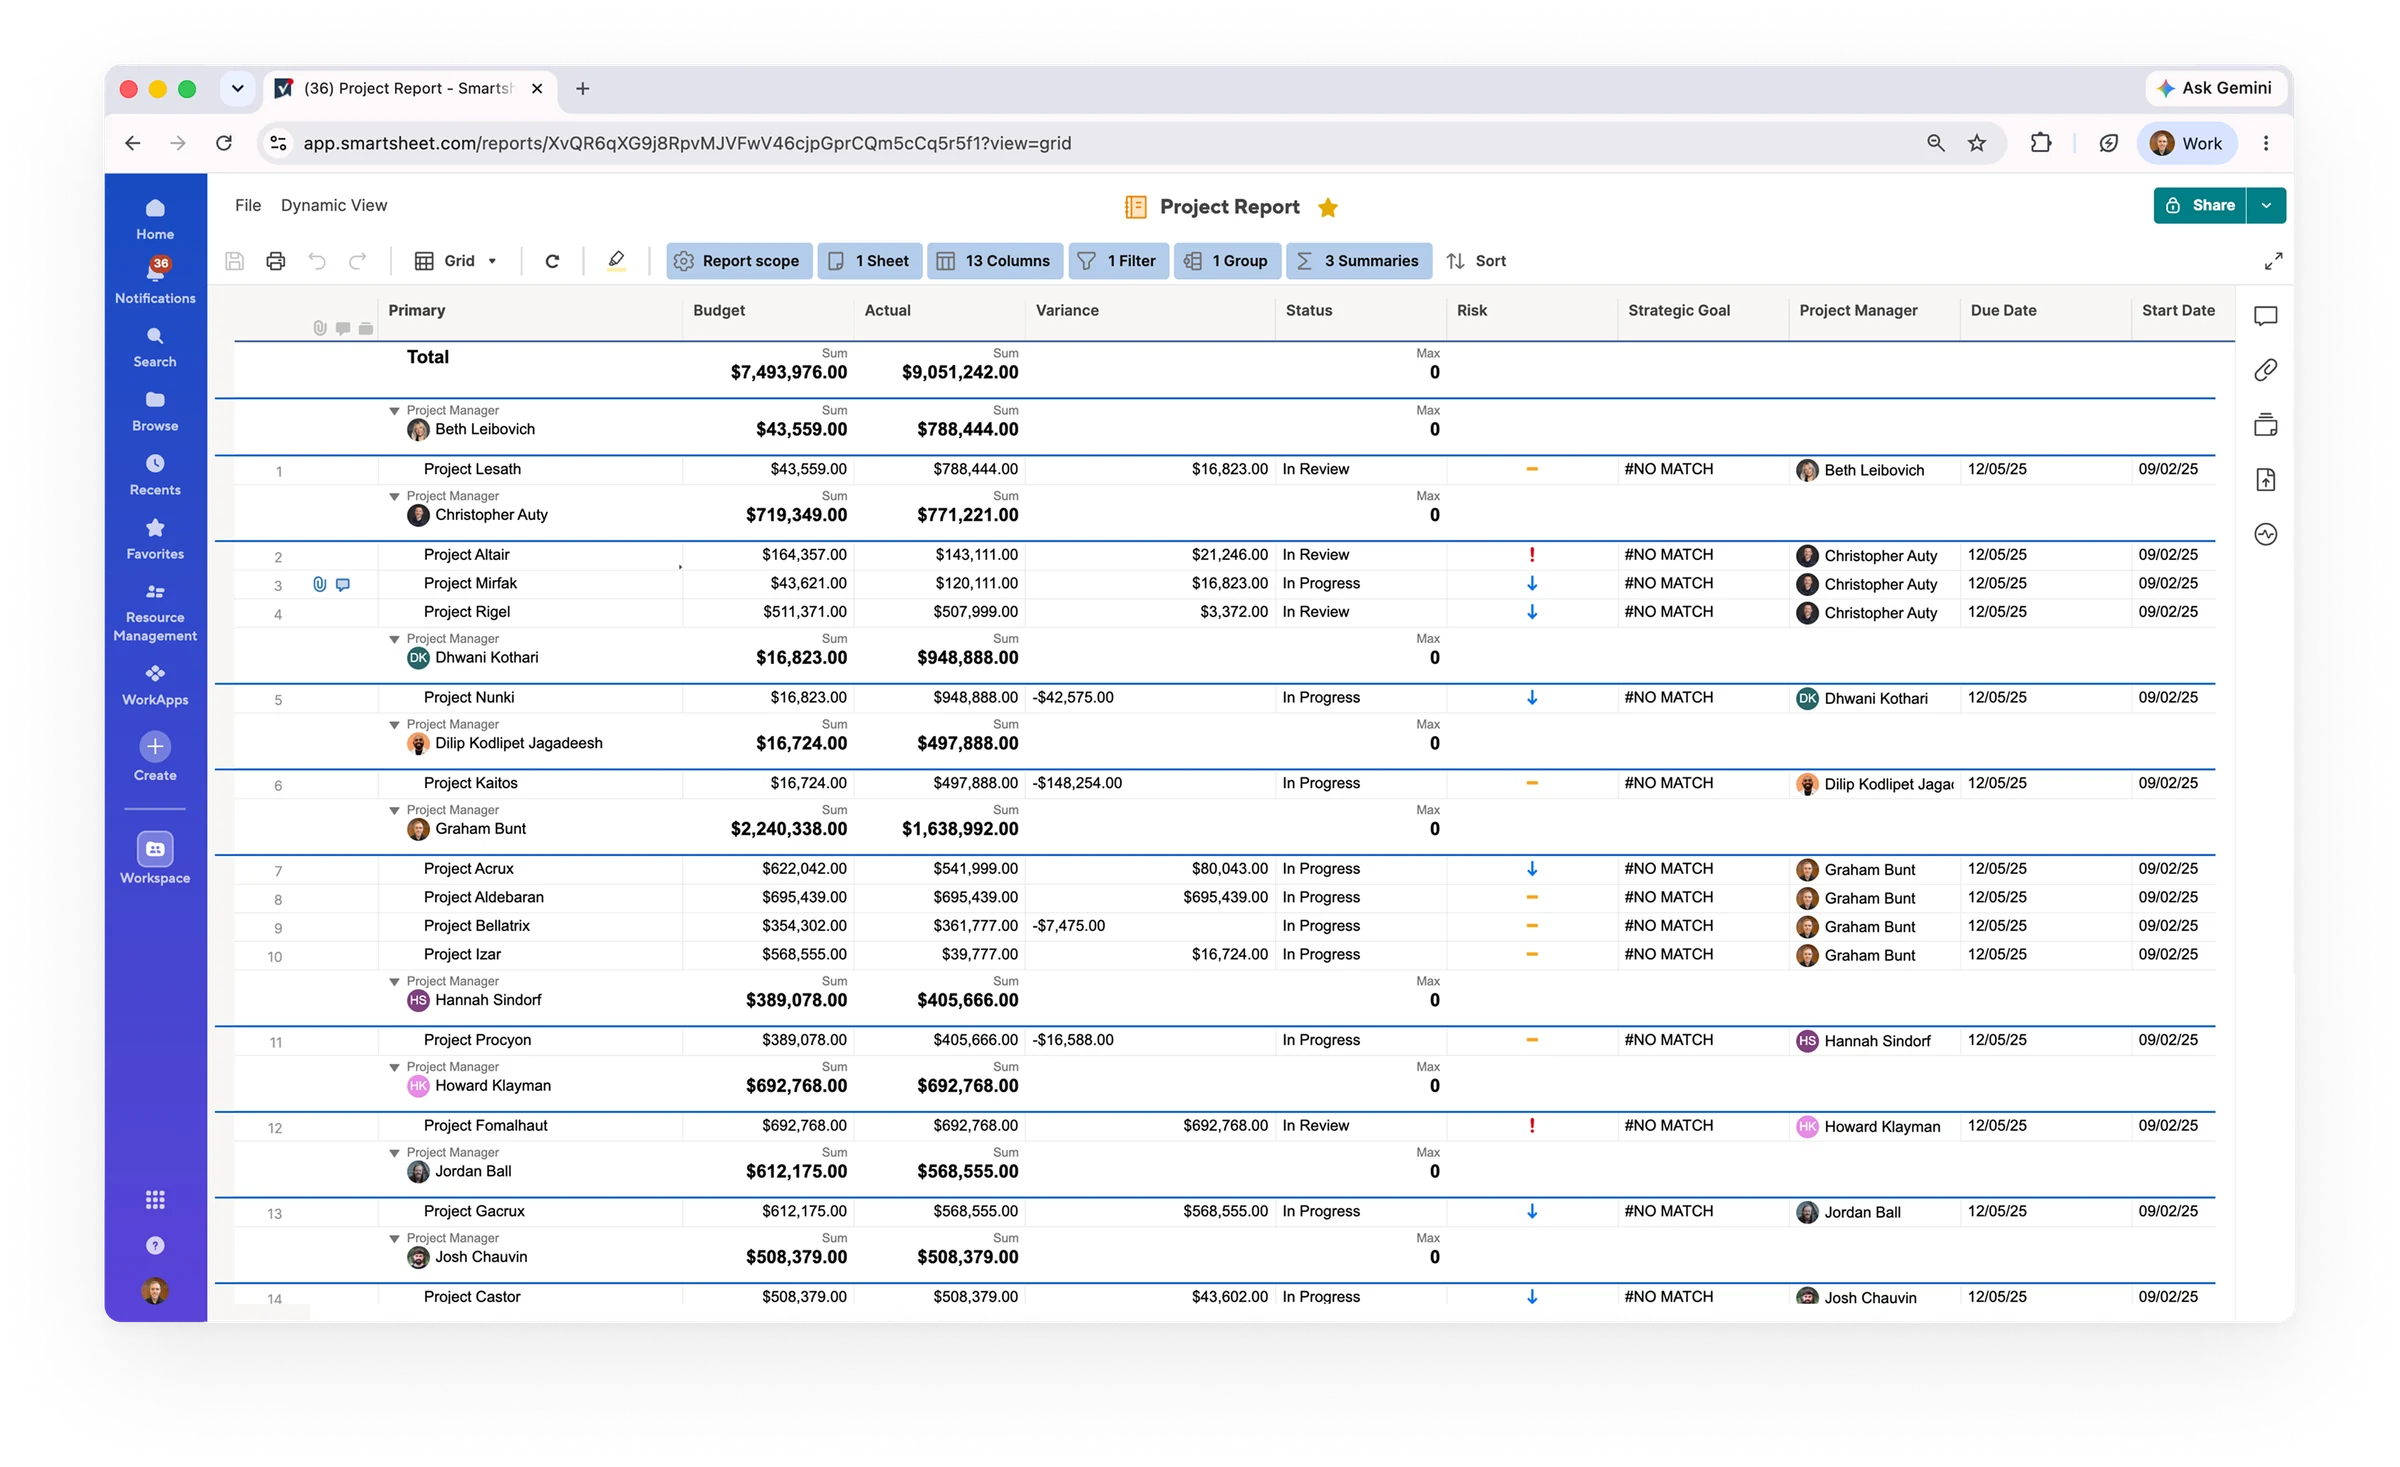
Only admins could edit the toolbar in the legacy report, while collaborators were completely shut out.
New paradigm
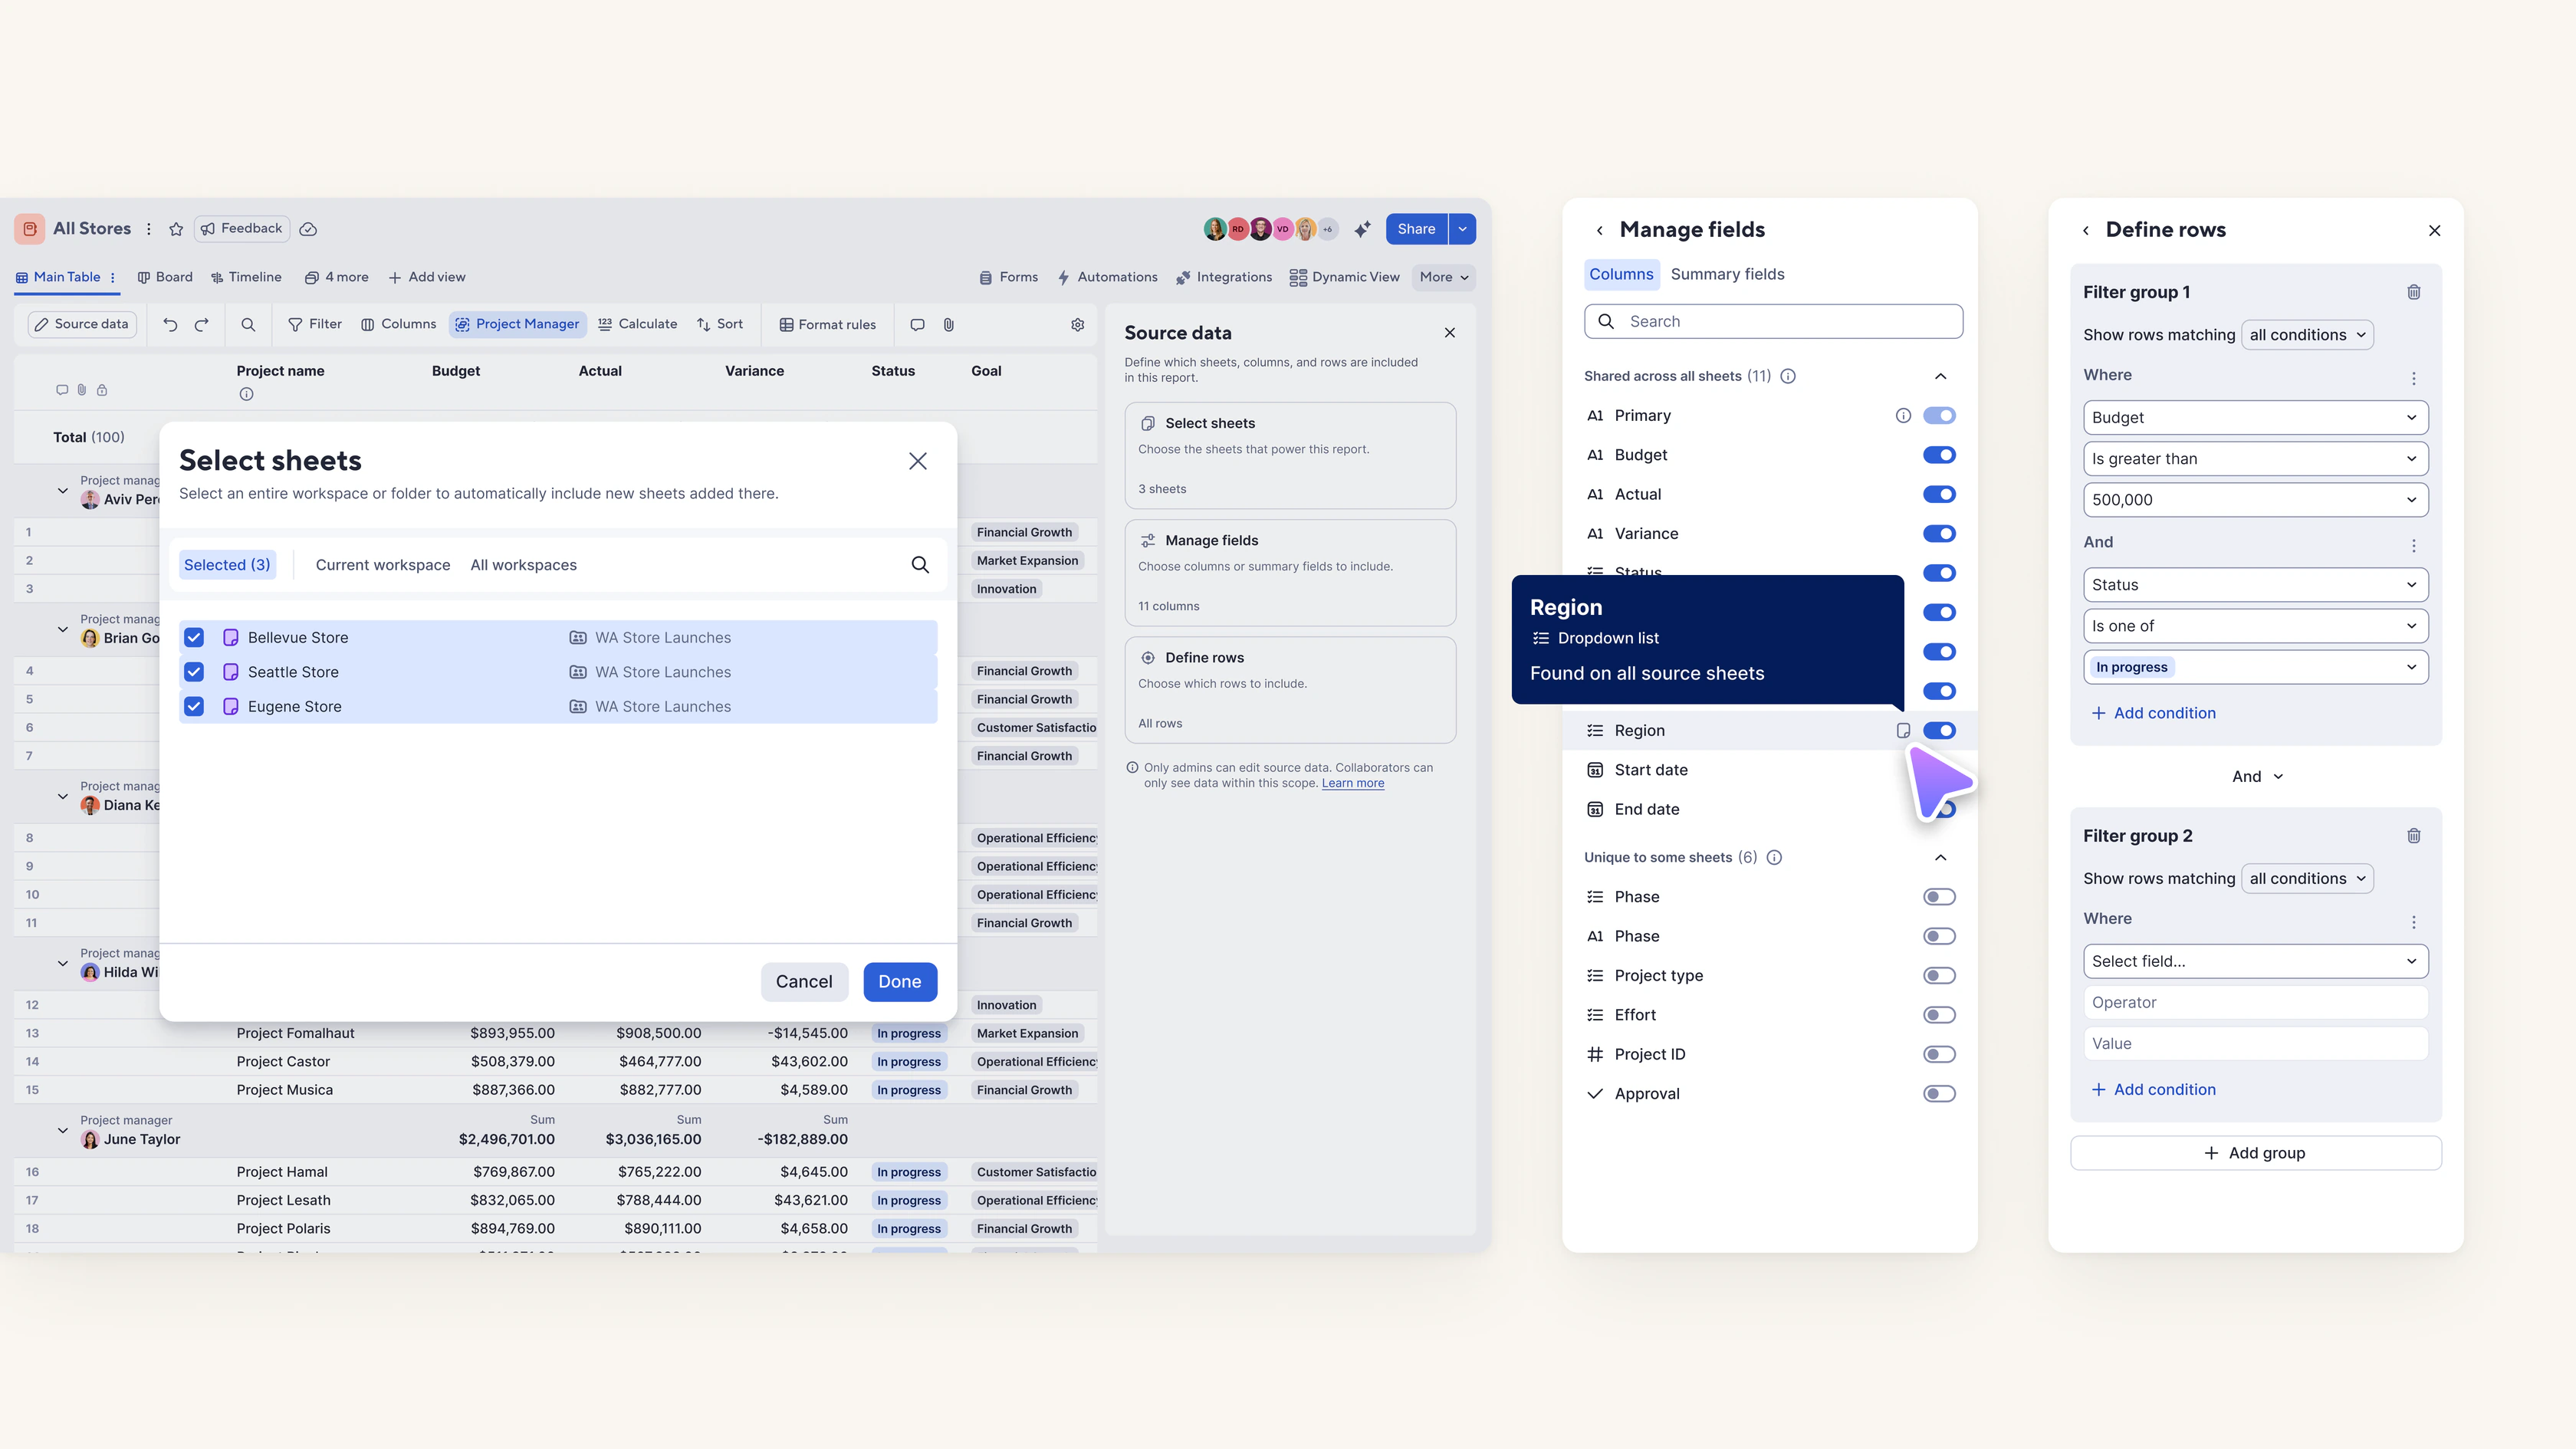
The main challenge was giving collaborators access to the toolbar while preserving admin control over what data belonged in the report and how it was aggregated.
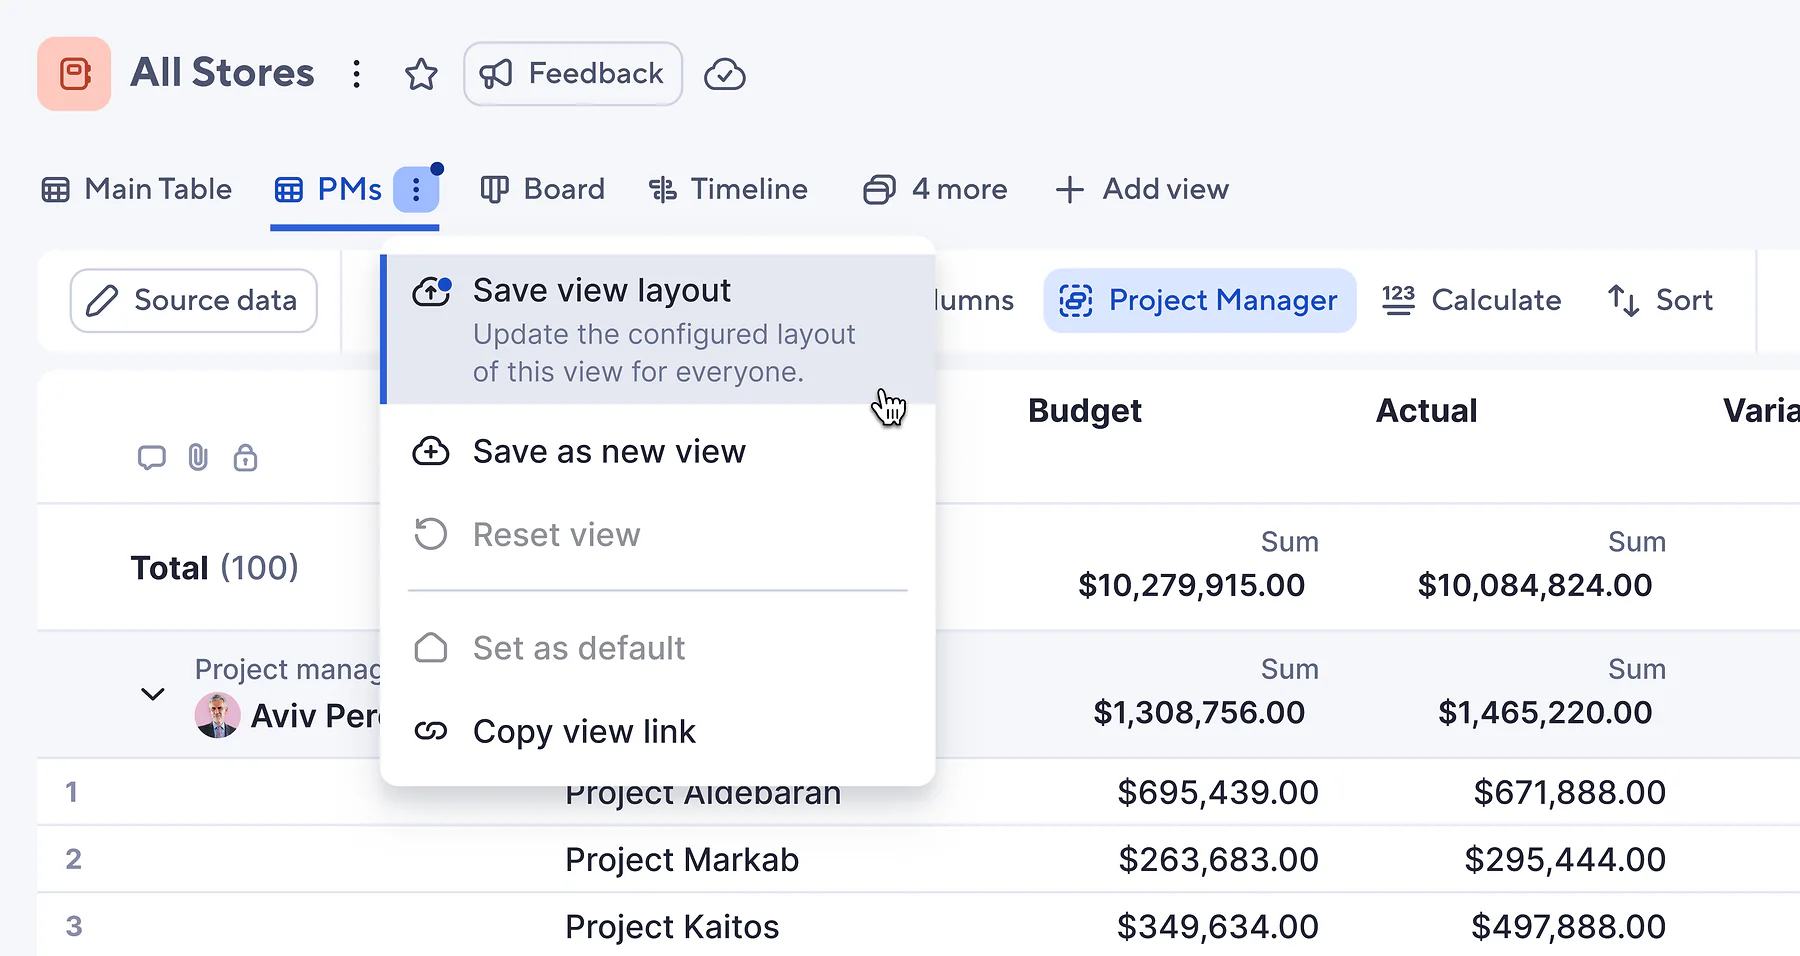
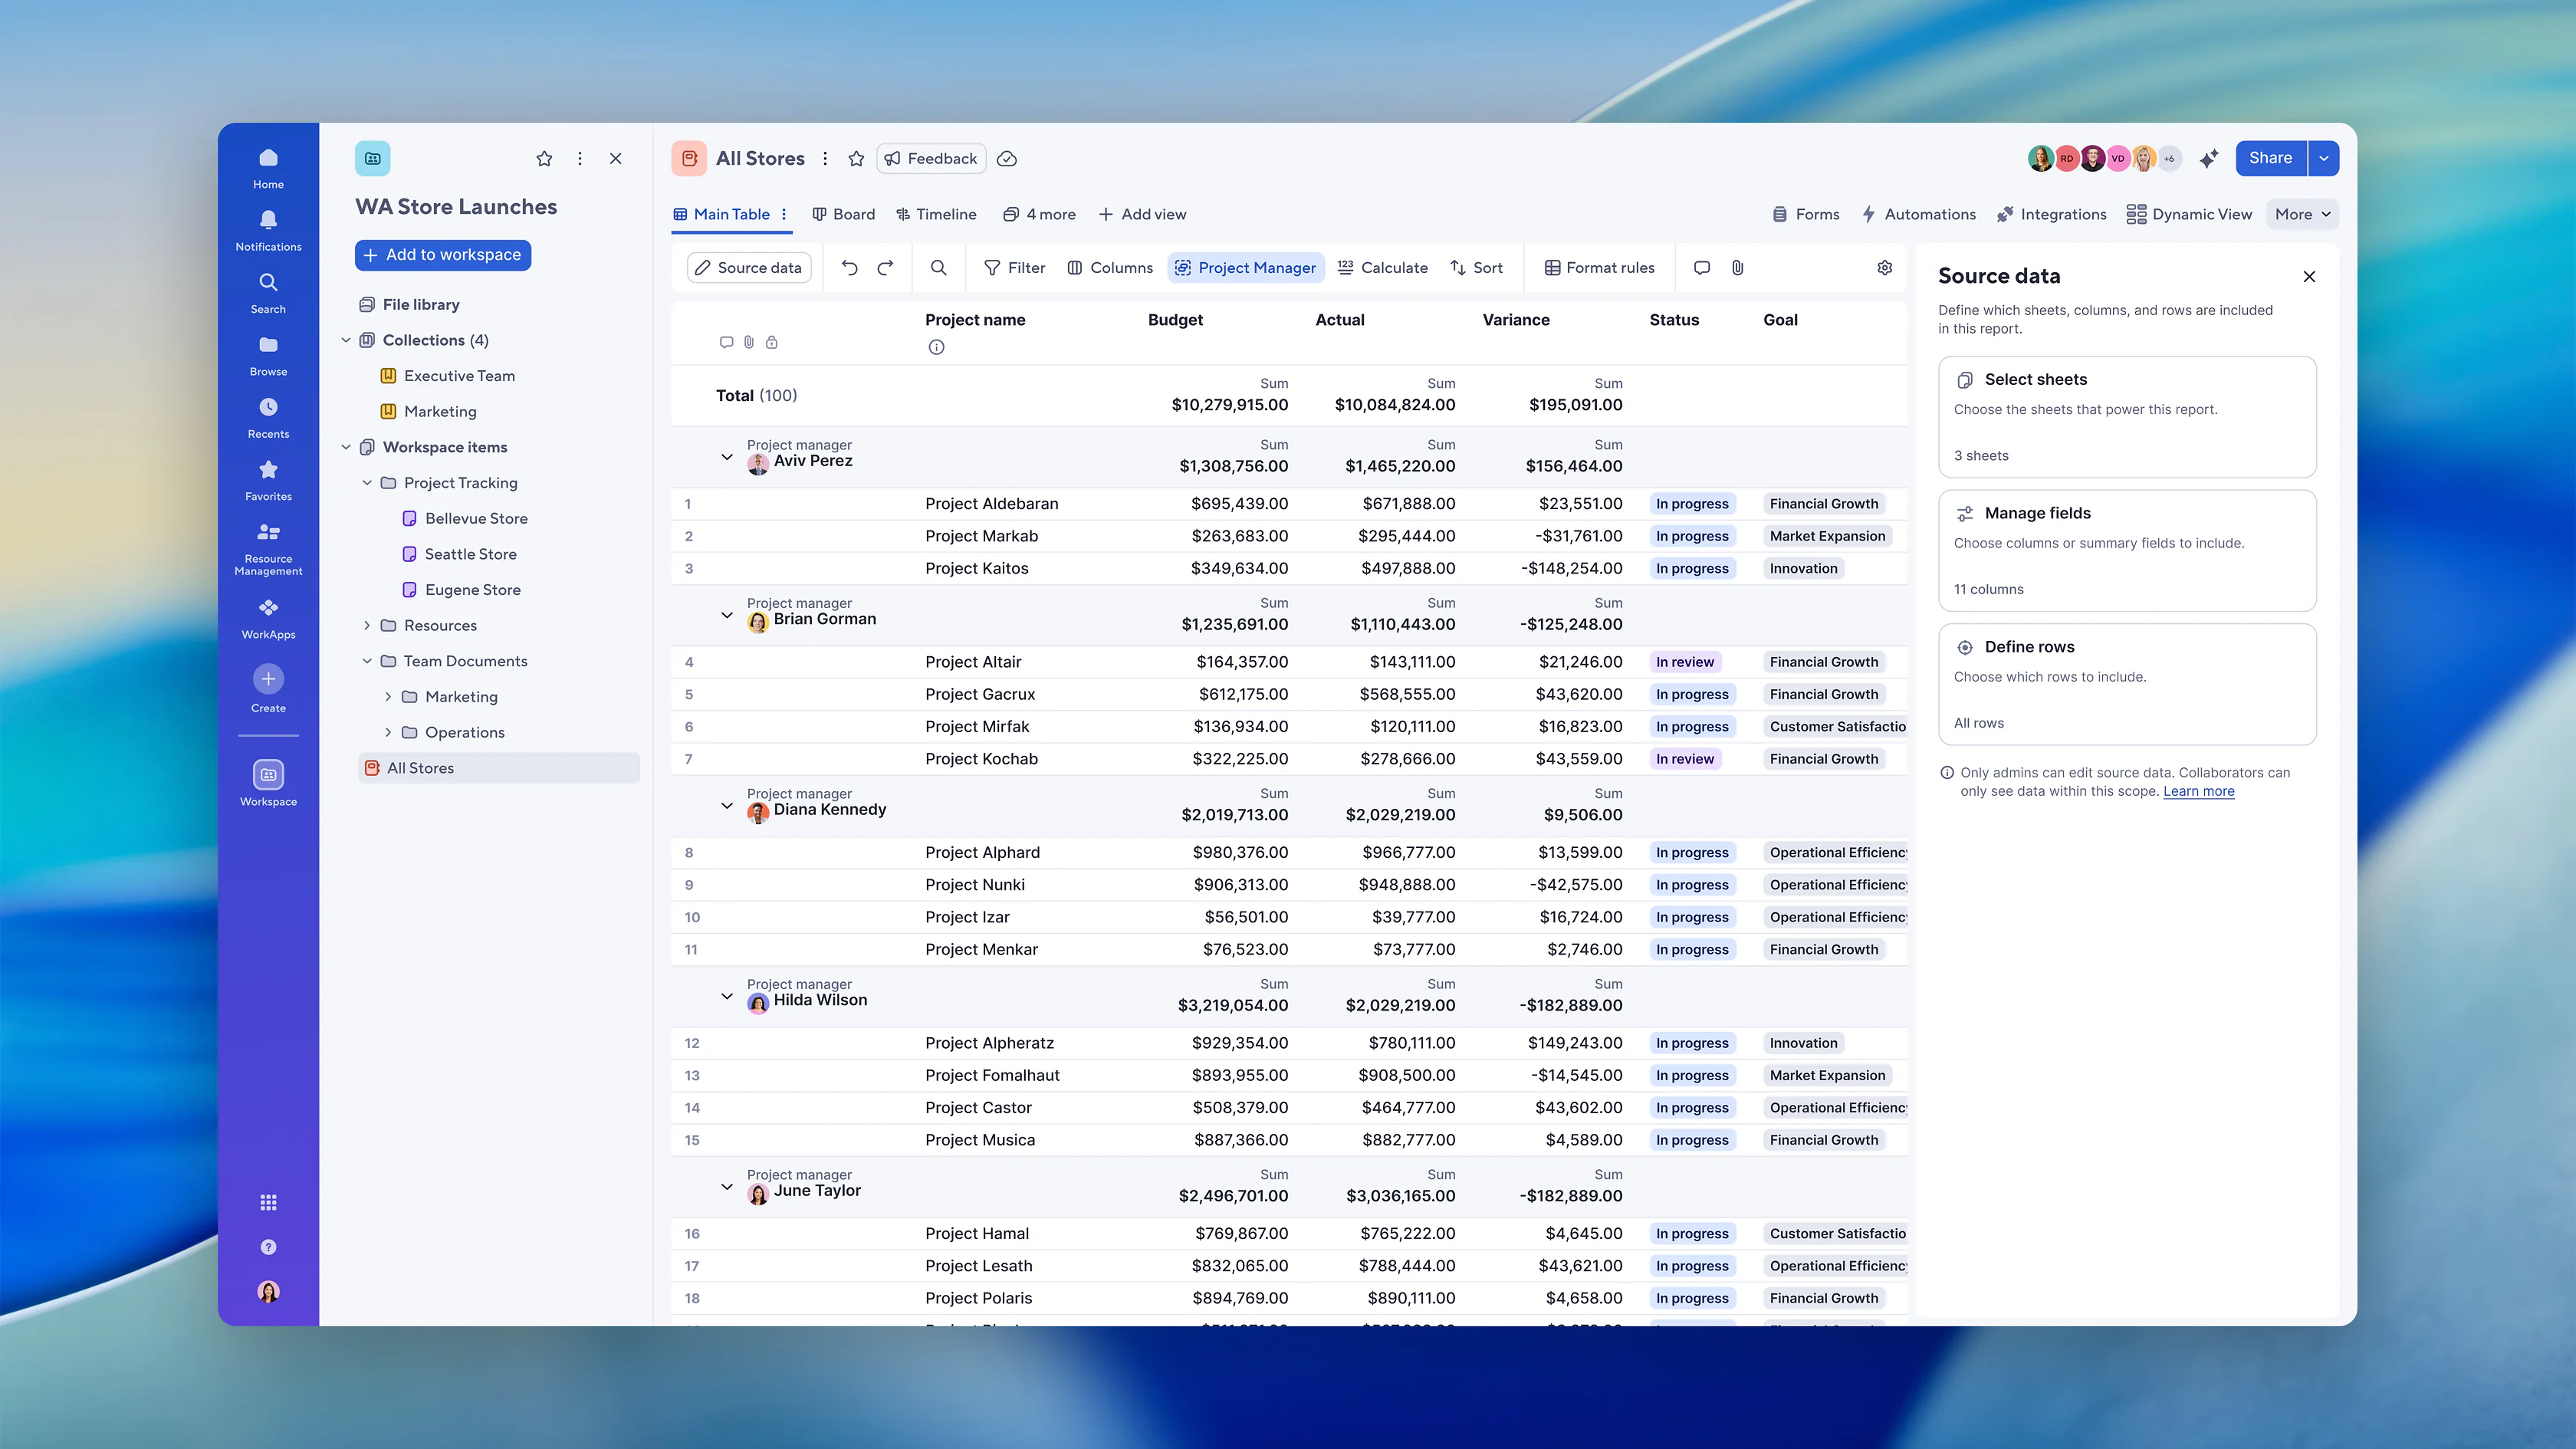
The final solution separated source data controls from display controls. Source data answered which sheets, fields, and rows belonged in the report and how the data was aggregated. The rest of the toolbar controls could then let collaborators explore the data within those bounds.
Ambiguity
Before implementation, our CPO posed an existential question: should reports exist as a separate asset?
The question was fair. Reports, sheets, and dynamic views had begun to overlap, leaving customers unsure which tool was right for the job.
I aligned three teams around a strategy to keep reports separate, avoiding a costly migration of millions of legacy reports while clarifying its role within the platform and creating a shared direction for future investment.
Execution
With the strategy in place, we modernized reports through a series of releases:
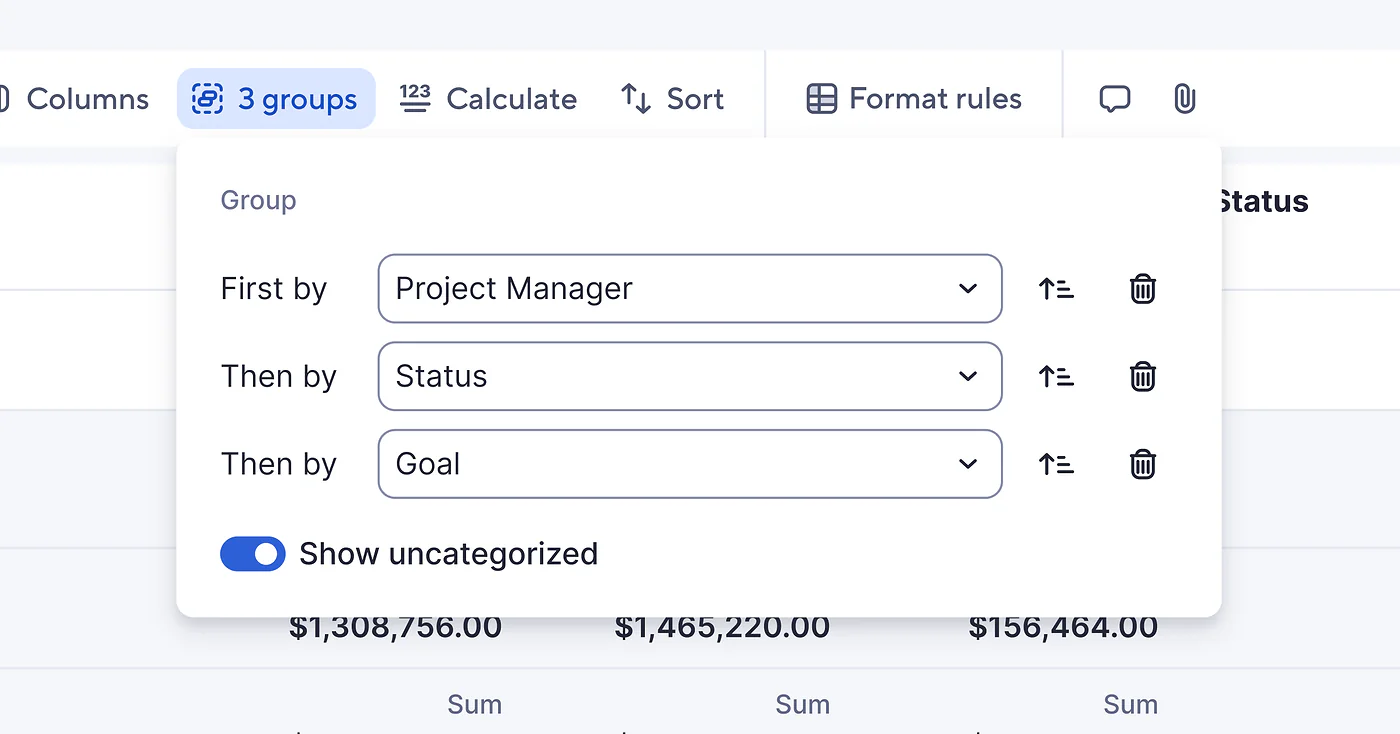
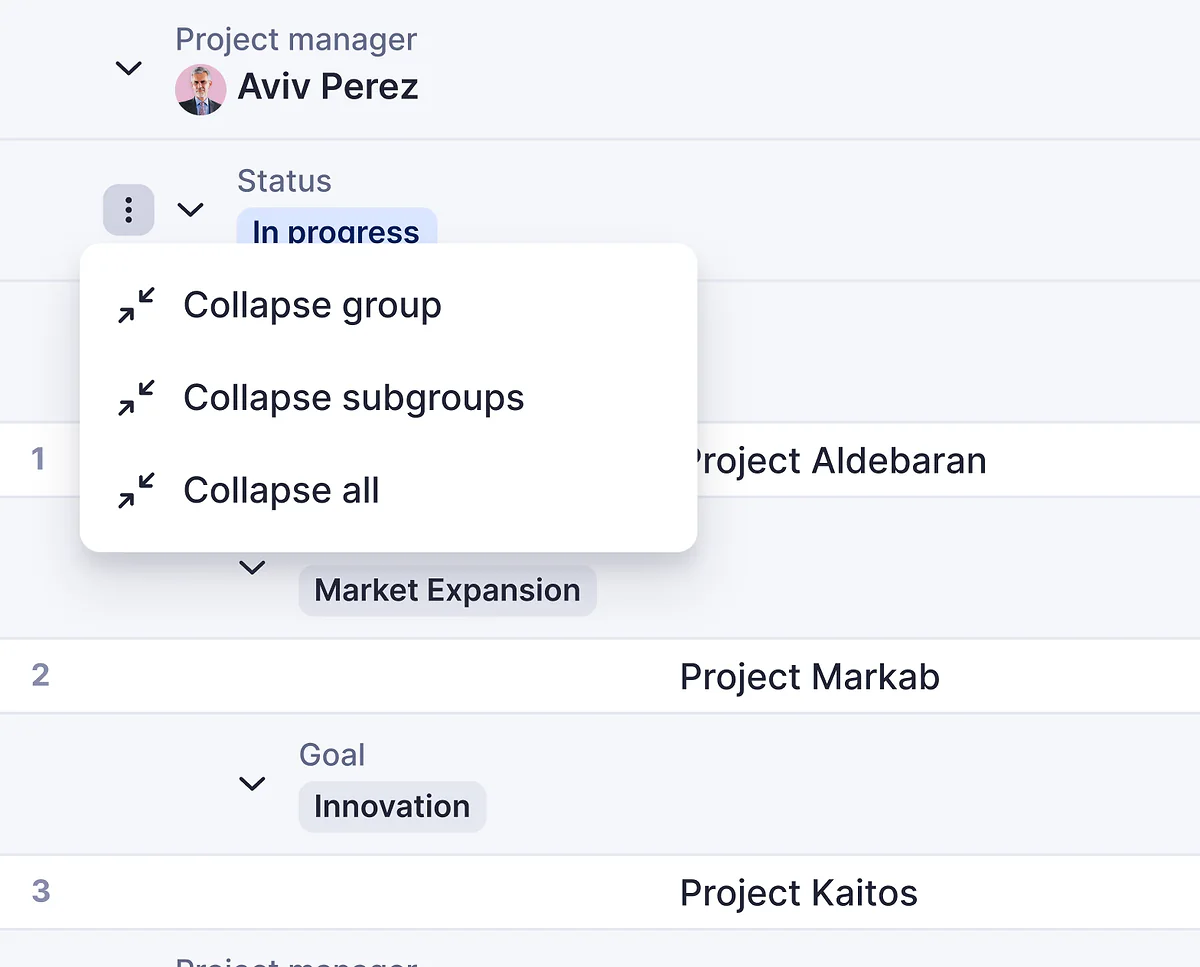
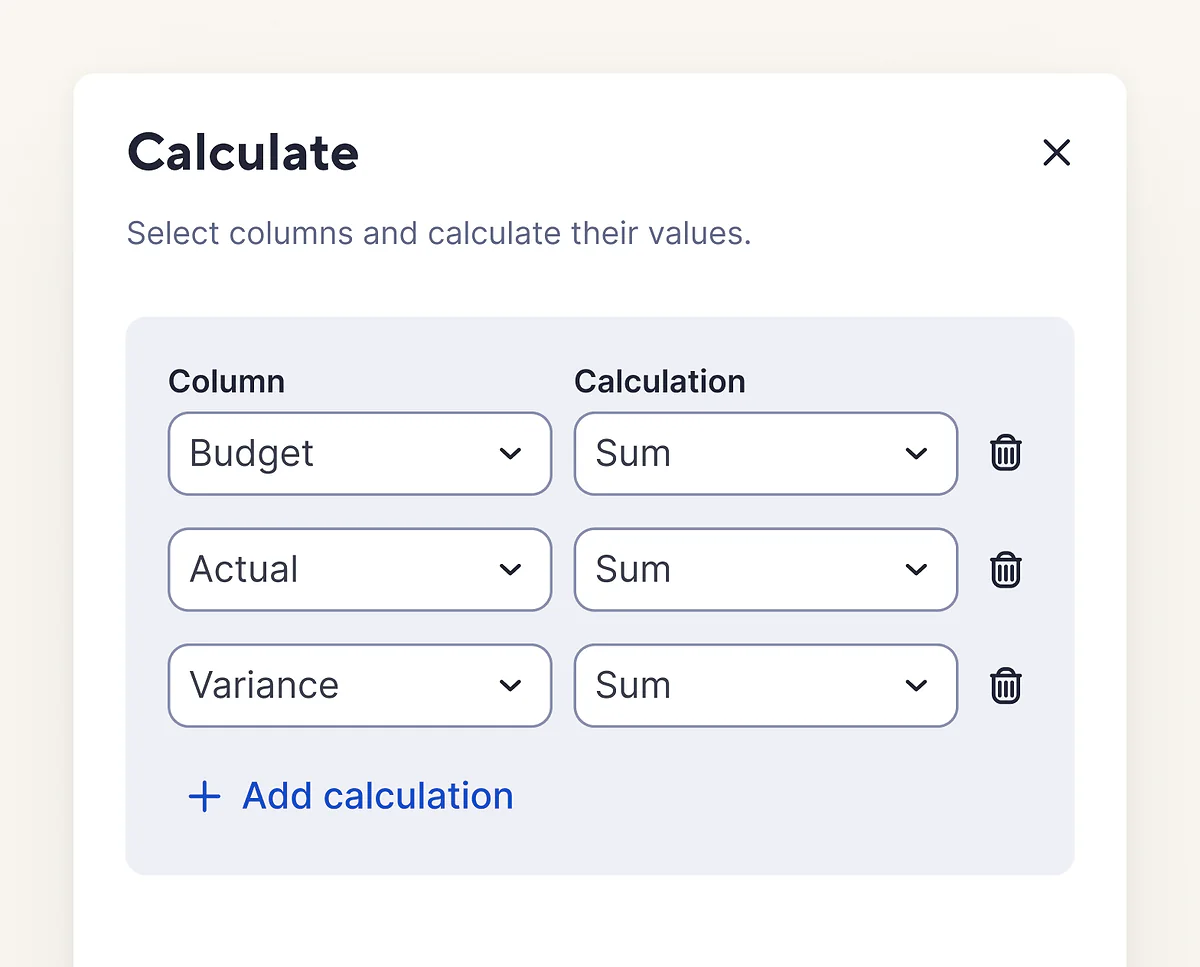
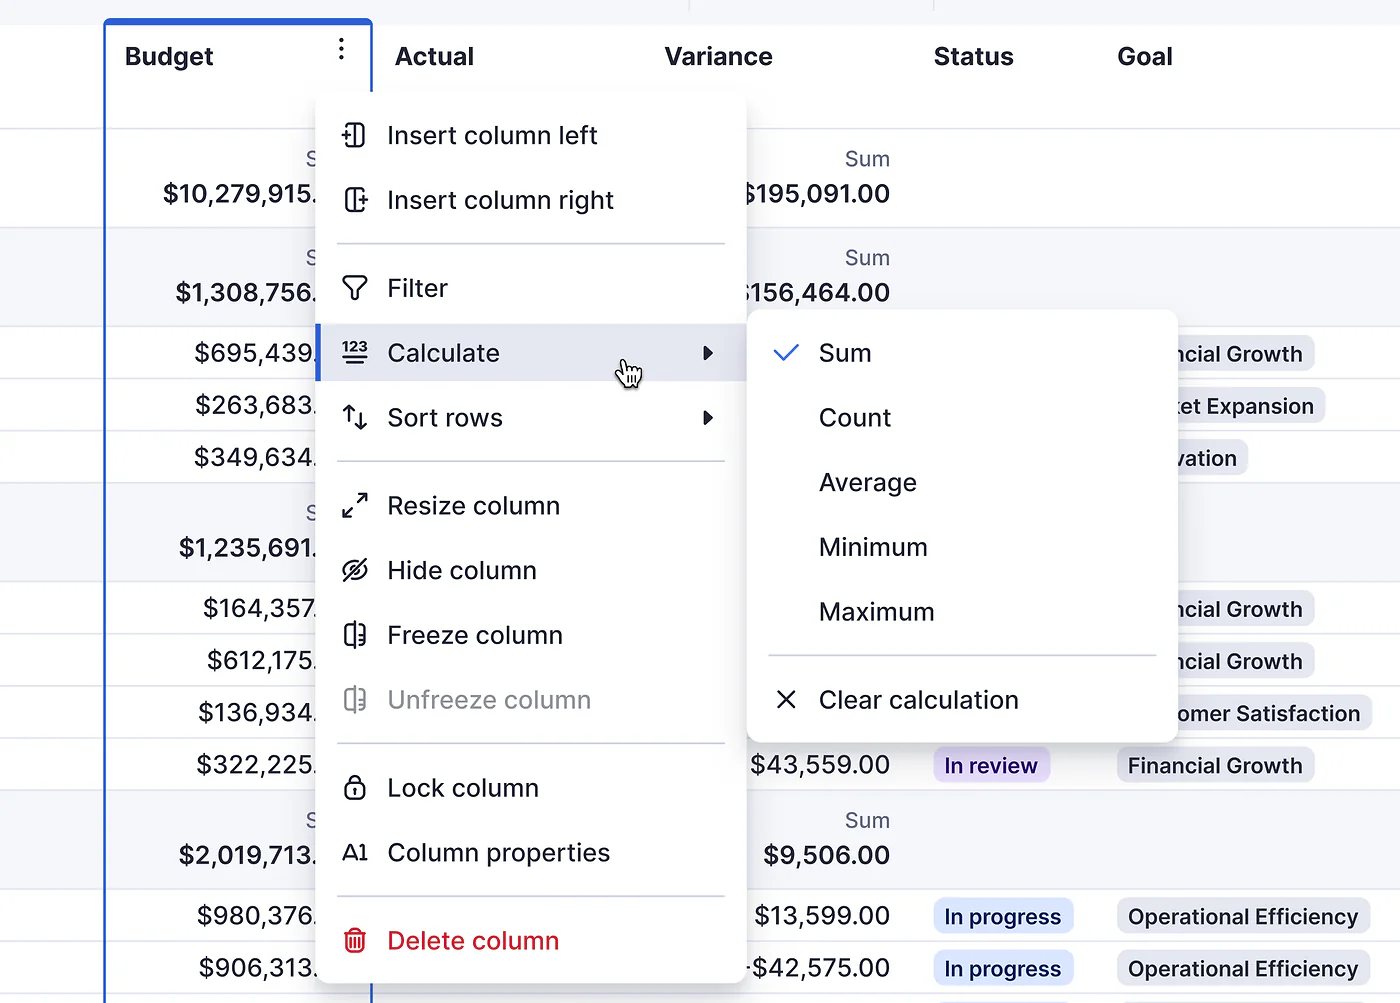
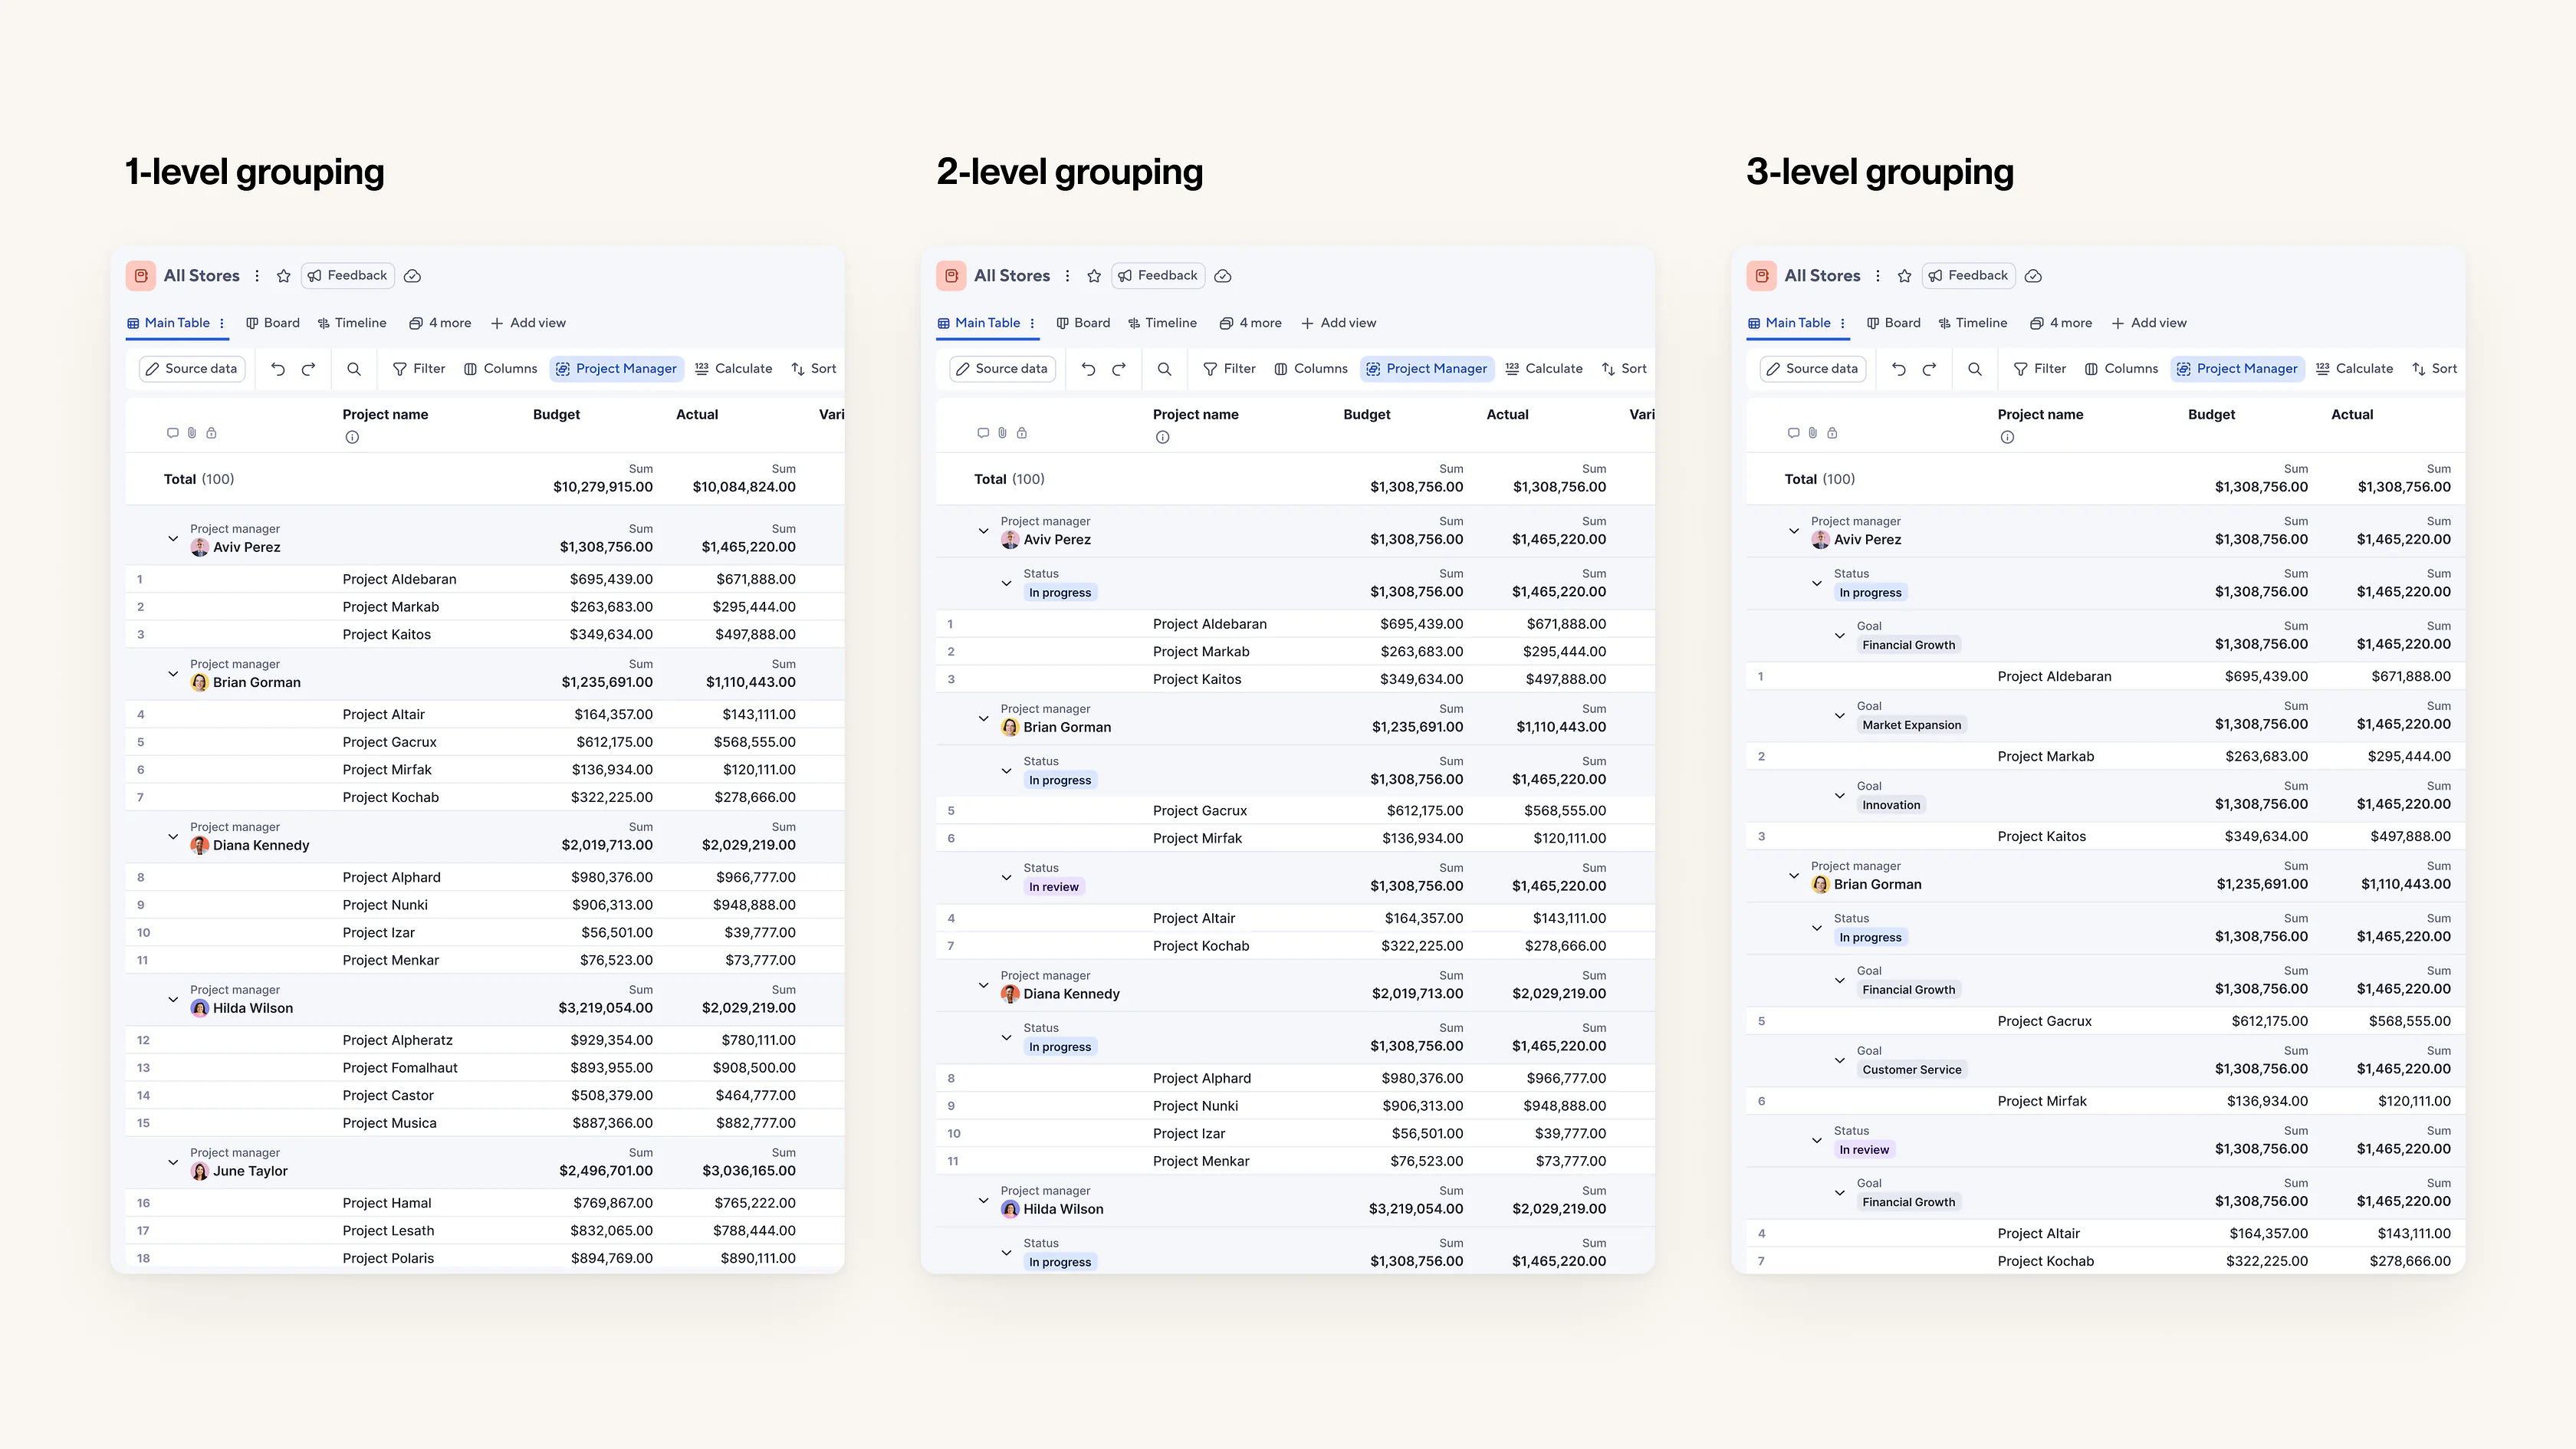
- Introduced the modern view with refreshed grouping and calculations, so customers could switch from legacy with their reports intact.
- Added source data, opening the toolbar to collaborators while preserving admin control.
- Launched a new first-time experience making the modern view the default starting place.
Reflection
The hardest part of this project wasn't redesigning the interface. It was defining the role reports should play within the platform and getting the team aligned. Once we had a shared direction, every downstream decision got easier, and the design work became an exercise in execution rather than existential debate.
Defining a clear strategy and aligning teams around it can be one of the biggest challenges in product development. It's also where I've found design can have the greatest impact.